Data-Ink Discipline
MasteredMaximized the ratio of information-bearing ink to decorative noise in every chart.
How it developed
Decades of redrawing canonical historical graphics by hand.
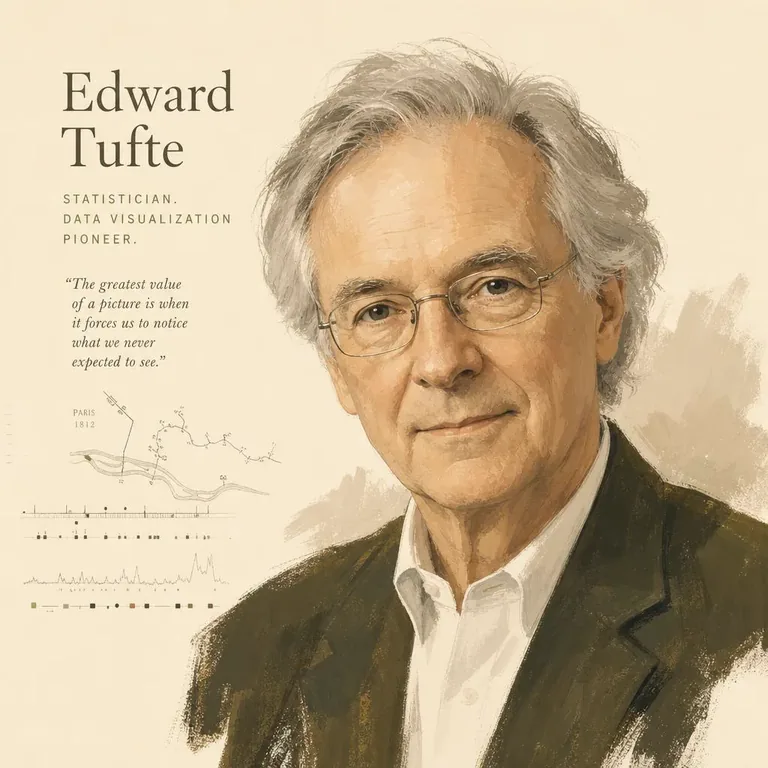
Statistician; Pioneer of Information Design.
Treated charts as a form of moral seriousness — taught a generation that bad visualizations don't merely confuse, they kill, and built the standards that distinguish honest evidence from decorated noise.
Every story has the highlights. This is the boring middle, the doubts, and the moments that quietly changed everything.
Father was a city manager; mother a teacher who emphasized rigor.
Small-town start with no obvious path to information design.
Disciplines you'll invent are easier to find from outside academic centers.
Studied statistics and political science with an emphasis on quantitative methods.
Bridging hard quantitative methods and political analysis.
The synthesis between disciplines is more original than mastery of one.
Dissertation used quantitative methods on political behavior.
Political science was largely qualitative at the time.
Bring the new tools to the field that needs them most.
Taught statistics and political science; co-authored quantitative methodology textbooks.
Establishing quantitative legitimacy in social sciences.
Teach the methods until they become normal.
Frustrated with bad charts in newspapers and journals, started cataloguing what worked.
No publishers wanted a book about graphics design.
Sometimes the book has to invent its own audience.
Became Senior Critic in graphic design as well as Political Science professor.
Crossing departmental lines at a research university.
Cross-appointments are how new fields get institutional cover.
Mortgaged his house to print and design the book exactly as he wanted.
Publishers wouldn't commit to the craftsmanship he demanded.
When publishers won't say yes to quality, become the publisher.
Second canonical book — won 17 awards and defined his publishing aesthetic.
Maintaining production quality while scaling distribution.
Craft compounds when you control the supply chain.
Third book — case studies on cause and effect including the Challenger disaster.
Translating statistical critique into accessible narrative.
Powerful stories make statistical lessons stick.
Argued PowerPoint had bureaucratized thinking and contributed to the Columbia shuttle disaster.
Taking on Microsoft's most-used product in a 28-page essay.
Targeting the right monopoly with a focused critique amplifies impact.
Fourth book — introduced sparklines and the discipline of integrated visual reasoning.
Synthesizing 30 years of teaching into one design philosophy.
The capstone book defines how your discipline is taught after you.
Joined Obama's Recovery Accountability and Transparency Board to design public spending dashboards.
Applying his principles inside a federal bureaucracy.
Information design has civic stakes the discipline often underestimates.
Day-long Tufte courses still draw analysts, designers, and engineers from across industries.
Sustaining a one-person teaching brand for four decades.
A reliable in-person teaching practice can outlast any platform.
Skills aren't talents — they're the residue of a thousand decisions. Here is what compounded over a lifetime.
Maximized the ratio of information-bearing ink to decorative noise in every chart.
Decades of redrawing canonical historical graphics by hand.
Pulled examples from 18th-century French maps to 1986 NASA reports to make every point.
Obsessive archival research.
Designed every page of his books personally — typography, layout, paper stock, ink.
Built his own publishing company to enforce standards.
Picked specific high-stakes examples (Challenger, PowerPoint) and dissected them publicly.
Decades of teaching and writing case studies.
Held attention for a full day in workshops attended by tens of thousands of professionals.
Refined over hundreds of repeat-performance sessions.
Trained as a serious statistician before becoming a designer.
PhD-level statistical methodology training.
Wrote so designers could learn statistics and statisticians could learn design.
Wrote and revised until both audiences could read fluently.
No journey is a straight line. The setbacks weren't detours — they were the route.
No major press wanted to invest in the craftsmanship he required.
Mortgaged his house, started Graphics Press, and out-sold them all.
Sometimes you have to build the distribution channel yourself.
Microsoft and many corporate trainers attacked his Columbia analysis.
Held to the analysis; the critique stayed canonical.
Specific high-stakes targets attract specific attacks; weather them.
His influence in static analytics was huge but slower to permeate live dashboards.
Modern dashboard tooling eventually adopted sparklines and small multiples.
Patient principles outlast the medium they were first taught in.
Mainstream statistics journals were slow to cite his work as 'real statistics.'
Built influence outside the journals through books, workshops, and consulting.
Disciplinary acceptance is optional when public impact is the real metric.
The books on the shelf, the people they studied, the ideas they kept returning to.
Edward Tufte
The canonical text on chart design; the foundation of modern information design.
Edward Tufte
Designing complex multivariate displays across maps, schedules, and timelines.
Edward Tufte
Cause and effect; includes the Challenger and cholera-map case studies.
Edward Tufte
His capstone — sparklines, integrated graphics, and the discipline of evidence.
Edward Tufte
His 28-page essay on how slideware corrupts thinking.
Edward Tufte
His early statistical methodology textbook from his Princeton years.
Interviews, keynotes, talks, and documentaries — chosen for the moments that reveal how they actually thought.
The bets that, made differently, would have written a different life.
AI-distilled takeaways, sorted by who you are and what you're building toward.
Every drop of ink that doesn't carry information is noise.
Decoration is a tax on the reader; pay it sparingly.
Trends in context beat dashboards full of giant charts.
If publishers won't honor quality, become the publisher.
Snow's map and Minard's campaign teach more than any modern dashboard.
Treat clear graphics as a moral obligation, especially in safety-critical fields.
PowerPoint is a vendor of conclusions; demand the underlying tables.
The questions most people have after studying this life. Tap one — every answer is built from Edward Tufte's own timeline, decisions, books, and lessons on this page.
Adjacent journeys, a collection that frames the craft, and one pick from a different world.
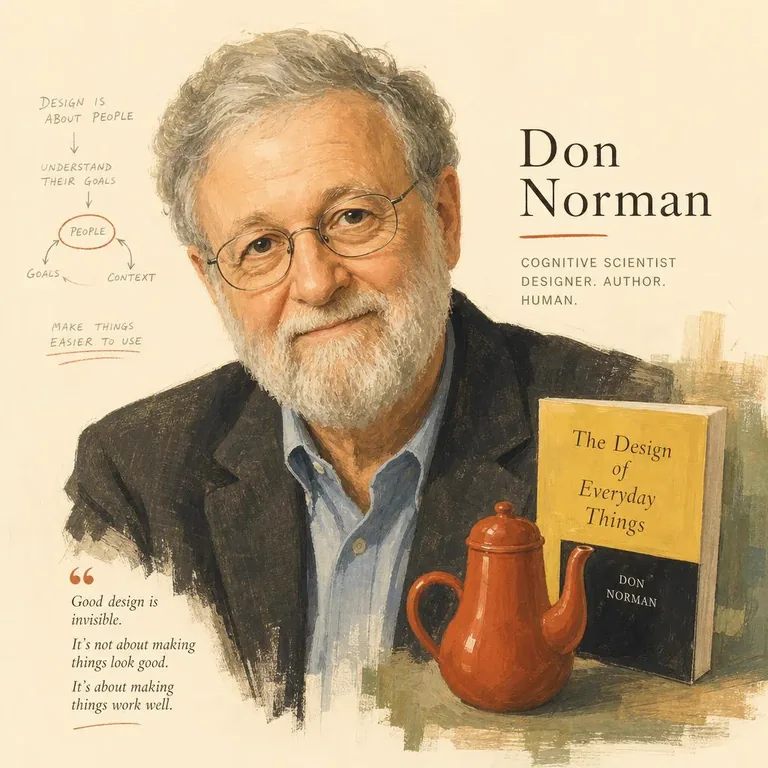
Coined 'user experience' and built the field — by insisting that confusing doors and broken stovetops were design failures, not user failures, and that cognition is what design actually serves.
Read Journey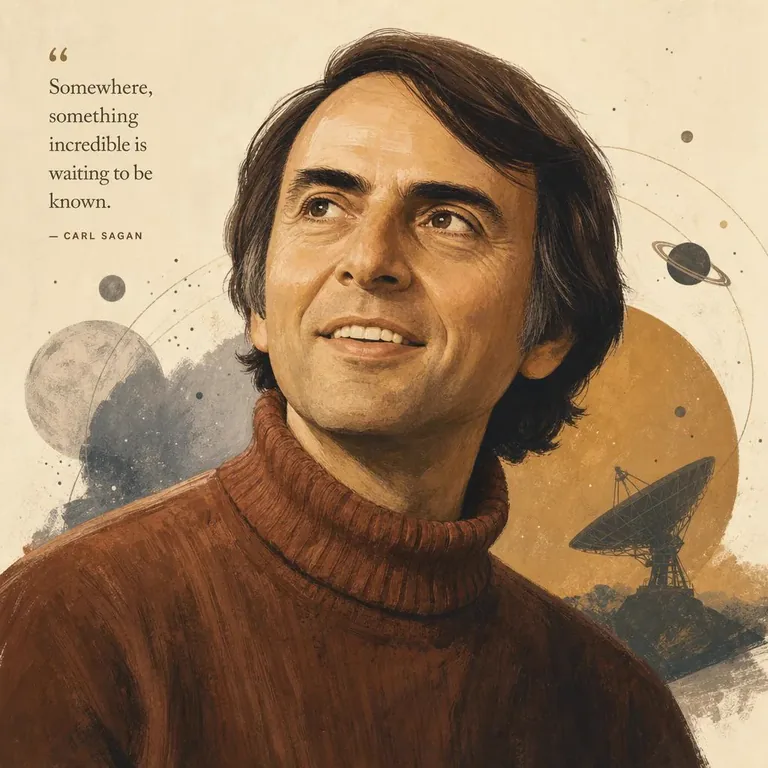
Built the most-watched science series in television history, talked to a planet about the Pale Blue Dot, and proved that rigorous astronomy and lyrical prose could share the same sentence — and the same career.
Read Journey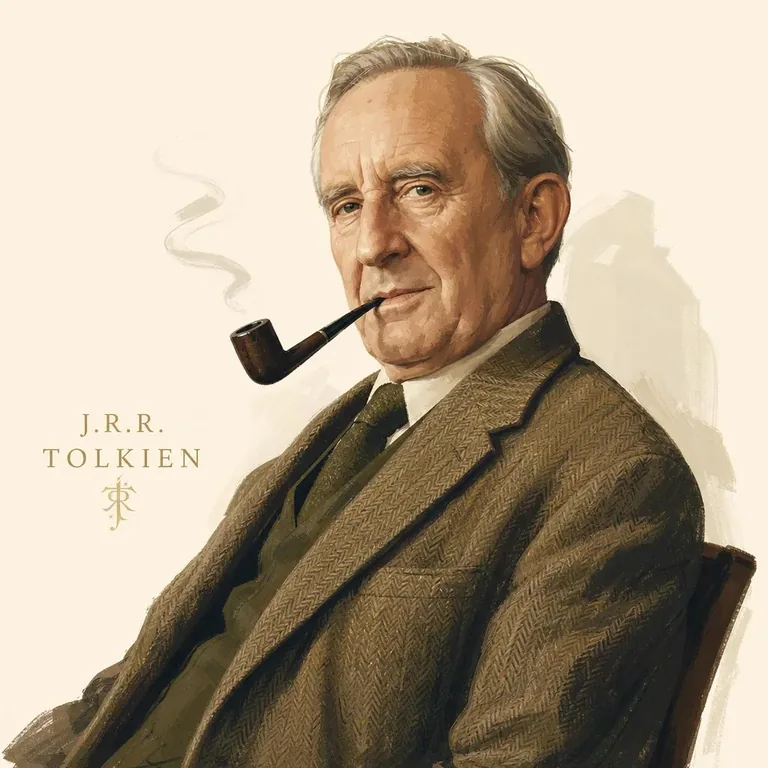
Invented languages first, then the world they would be spoken in — and proved that a single Oxford philologist, working evenings for forty years, could create the mythology a country didn't know it was missing.
Read Journey
A Brooklyn-born Nobel laureate who reformulated quantum electrodynamics, played bongos in the Caltech faculty band, cracked Los Alamos safes for sport, and taught millions to think like a physicist.
Read Journey


Taste as a leadership discipline. Founders and operators who used design culture as a competitive moat.
Open CollectionI left a PhD program convinced I had failed at science. A classroom of fifteen-year-olds gave it back to me, slower and better.
Read Story
Founder of Tesla & SpaceX
An obsessive engineer betting on rockets, electric cars, and the impossible — applying first-principles thinking at planetary scale.
Open Journey